|
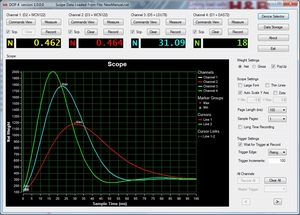
The DOP software can visualize the input from your scale and show it as a graph. All input data from the device are stored in the DOP and therefore it is possible to zoom in and out, store the data on disk and to analyze the data more carefully.
You can also print the graph or save it as JPG and use it for documentation.
The DOP software is often updated, so please check the site frequently for new updates.
The latest version is found here: DOP4
|
|

|